SANAE IV SuperDARN
Introduction
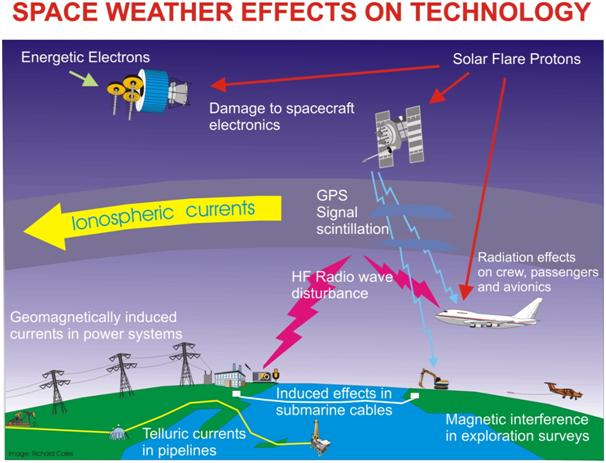
The Super Dual Auroral Radar Network (SuperDARN) is an international collaboration of researchers interested in Earth’s near-space plasma environment. This group uses high frequency (HF) radars and backscatter from magnetic field-aligned plasma irregularities to measure their position and Doppler velocity in order to study space weather manifested in the Earth’s magnetic field (magnetosphere) and ionosphere. The movements of these irregularities are tied to the movements of the Earth’s magnetic field which, in turn, extends into space. Space weather impacts many technological systems including Global Positioning System (GPS), spacecraft orbits, power distribution, surveillance radar, HF communications and transpolar aviation as shown in Figure 1.
Background
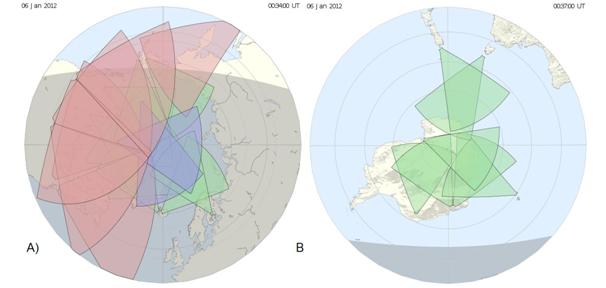
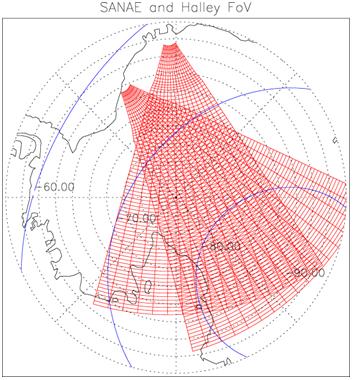
The global network of HF radars currently consists of 25 radars operated by 11 major partner countries. Figure 2a shows the fields of view for the 18 northern hemisphere radars, and Figure 2b shows the fields of view for the seven southern hemisphere radars. There are more radars in the northern hemisphere because there is more land-mass within measurement distance of the north pole. A radar, which was previously deployed in the Falkland Islands, is currently being relocated to Halley, Antarctica, which will soon bring the number of radars in the southern hemisphere to eight.
Unlike polar orbiting satellites, which only pass over a specific area a few times per day, HF radars permit continuous monitoring of these regions. Ground-based systems are also much cheaper to build, operate and maintain than space-craft. The SuperDARN network is still expanding, with new radars joining the network almost yearly. SuperDARN is also being extended to the mid-latitudes with the data being used not only for space weather but also for oceanography, with the combined footprints of the network covering ever increasing portions of the Earth’s oceans.
The Ionosphere
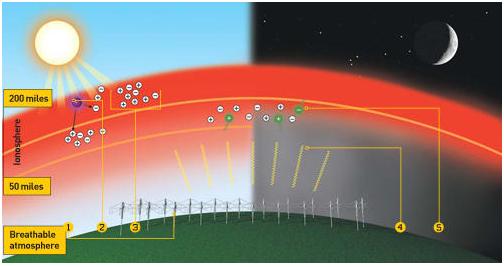
The ionosphere is so named because it is a layer of the upper atmosphere which consists of ionized particles (atoms that have lost or gained an electron) as well as free electrons. It exists due to solar radiation. The ionosphere starts at an altitude of approximately 60 km and extends up to over 1000 km. It is a layered structure (5) and the concentration of ions and electrons vary with altitude, local time, season and solar activity.
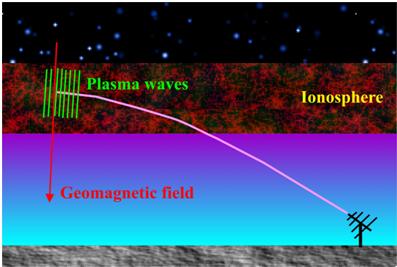
Radars studying the ionosphere only receive backscatter from irregularities that are aligned with the Earth’s magnetic field. In order to get a signal to reflect off an irregularity, the signal needs to travel at 90 degrees (orthogonal) to the geomagnetic field lines, as shown in Figure 4. This condition limits observing field-aligned backscatter to certain locations on the Earth. Two areas where radars can easily send a radio wave orthogonal to the geomagnetic field lines are in the high-latitude and equatorial zones, which is why many of these radars are located in the polar regions.
Operation
All SuperDARN radars must adhere to the rules governing operating times. There are three kinds of operating times, Common Time, Special Time, and Discretionary Time. Common Time comprises at least 50% of the overall operating time available to the radar network. Special Time comprises a maximum of 20% of the available operating time, and involves the use of all SuperDARN radars for special experiments. All radars will usually run the same operating mode to achieve a common goal. Discretionary time comprises a maximum of 30% of the available operating time, and can be used by the individual stations as they see fit. Maintenance is usually performed during discretionary time.
Monthly schedule files are created to coordinate the operating times for all SuperDARN radars. The SuperDARN radar scheduling committee determines the optimum use of operating modes for the SuperDARN community, attempting where possible to accommodate requests for Discretionary Time.
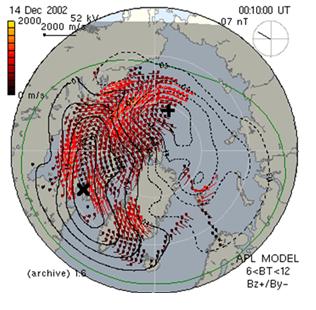
Each radar produces the same data product such that at any given time, data from every radar can be easily compiled together and a snapshot of the ionospheric conditions provided. One data product, shown in Figure 5, for the SuperDARN group is the drift velocity and position of returns from field-aligned irregularities in the ionosphere. These measurements from multiple radars can be used to produce a space weather map of ionospheric plasma motion. This map of space weather conditions is used by researchers in order to understand other ground-based and space-craft measurements relating to the ionosphere and the Earth’s space weather.
A Little Technical Information
SuperDARN radars transmit electromagnetic energy in the form of HF radio waves with frequencies of 8–20 MHz, with corresponding wavelengths of 37.5–15.0 metres. HF radio waves interact with irregularities in the ionospheric plasma with a scale size of roughly half the transmitted wavelength (Bragg scatter). Plasma is electrically conductive so it responds strongly to electromagnetic fields.
SuperDARN radars are pulsed monostatic radar systems, i.e. the main array is used to transmit and receive. As illustrated in Figure 6, these radars have an azimuthal resolution of approximately 4º for a transmission frequency of 12 MHz. The radars are steered in azimuth (angle looking from above) by using preset time delays that produce 16 beams separated by 3.3º, thus achieving a nominal 52º scan. The radial spatial resolution (distance of each block) is dependent on the transmitted pulse width; the standard pulse width is 300 ?s, which corresponds to 45 km.
The antennas are the most prominent feature of the radar. Due to their number and large size, they contribute a significant part of the overall cost of building the radar. A large number of antennas is required so that a narrow (more focused), steerable beam can be achieved. In order to support such a large antenna, considerable towers needed to be built. The SANAE IV radar was one of the first radars to be built in the Antarctic. The original antennas were not able withstand the harsh weather conditions and were subsequently destroyed in a big storm within the first year of operation. New antennas were deployed and lasted about ten years, but they too eventually succumbed to the climate. SANAE IV’s radar is now on its third set of antennas, which feature a much reduced wind profile. A four-element secondary array has also been added behind the main array in order to determine the angle of arrival of the back-scattered signal via interferometry.
South Africa's Role
Our radar was one of the first radars to be deployed in the network. I think we were the second radar to be deployed in the southern hemisphere, about one year after the British radar at Halley and shortly before the Japanese radar at Showa. Together these three stations formed a group called SHARE (The Southern Hemisphere Auroral Radar Experiment). The University of Natal (now UKZN), Potchefstroon University, the British Antarctic Survey as well as John’s Hopkins University shared in the initial development and cost of the infrastructure and hardware. SHARE then became part of SuperDARN and this nomenclature is now rarely used.
The radar has now been operating for over 15 years and has provided valuable data to the network’s scientific community. The SuperDARN website lists over 700 journal and conference papers published by researchers using SuperDARN data. Countless postgraduate degrees have also been awarded to physics and engineering students at home and abroad, who have used SuperDARN resources. As one can gather from the growing interest in space weather phenomena and the continued deployment of new SuperDARN radars all over the world, this trend is likely to continue into the foreseeable future, feeding local human capital development and increasing South Africa’s standing in the scientific and engineering communities. I believe that South Africa hosted the International SuperDARN conference in Hermanus in 2010, so we are definitely playing a key role in shaping the future of the network.